DMAIC Framework#
Define#
“Define”: What is the real problem we are facing? How can it be described?
Measure#
Measure is to better understand the problem and collect data. Sometimes the data is readily available, but at other times it may have to be collected through observation, accessed by retrieving data stored in a database, or by distributing questionnaires and surveys
Analyze#
Analyzed the data to better understand the problem, further reveal its root cause and point to a solution.
More advance statistical method are also used, such as confidence interval estimation, hypothesis testing and control charts.
Improve#
Action is taken to improve the process.
Depending on the nature of the problem, this can be as simple as eliminating steps, or purchasing new equipment, or as complex as redesigning almost every step in the process.
The real challenge here is “resistance to change”, where those involved in the old process resist the change that have become routine and familiar
Control#
Establishing monitoring and control procedures to ensure that process outputs conform to expected performance levels. The project closes with establishing and implementing these controls.
Gage R&R Study#
A Gage R&R study focuses on whether an individual collecting the data or performing the test is consistent across many measurements, and whether the variation between different people involved in the data collection is consistent.
- Repeatability
- Reproducibility
There are two types of Gage R&R studies: Crossed and Nested
Crossed Gage R&R study#
In Crossed Gage R&R study, parts are sampled from a process, and several operators are selected to participate in the measurement study. Each operator measures each part.
The problem with this approach is cause carryover effect. It occurs when the experience gained by operator one when measuring part one carryover and influence the operator’s measurement of part two this can bias the results.
Nested Gage R&R study#
The strategy is particularly relevant when testing past destroyed it. For example, when testing a shipment of air packs before they are assembled into an auto. Testing the airbag destroys it. Using this strategy, there’s no carryover effects since each operator only measures one part.
The disadvantage is that the strategy may require many more operators. For example 10 parts would be tested, then additional operator would be needed
Conducting the Gage R&R Study#
When conducting a gauge R&R study, the following steps are taken.
- A fixed number of parts, objects, or individuals are identified
- A fixed number of operators or observers are identified
- Each operator of observers initiate measurements of the objects a fixed number of times
When studies completed, the results are analyze, using computer based software that identify the measurement problems’source.
Precision and Accuracy#
Measure systems must be both accurate emphasize is important to distinguish between these two words
Persistent refers to the closeness of two or more measurements to each other if they are very close, then it might be the thought that the data are truly representative of the process of parts being measured yet this measurement by itself may not be sufficient.
Accuracy is the proximity of measurements results to the true value. It means that the data are indeed true representations of what it is we are trying to measure.
Bias is the difference between an observed measurement, and a reference value or standard. Bias is not limited to those measurements taken with an instrument. Human Bias is even more common.
Improving Process Flow#
There are several tools, considered part of the six sigma toolkit, that help define design and improve process flow
- SIPOC Diagram
- Value Stream Map
- Process Map
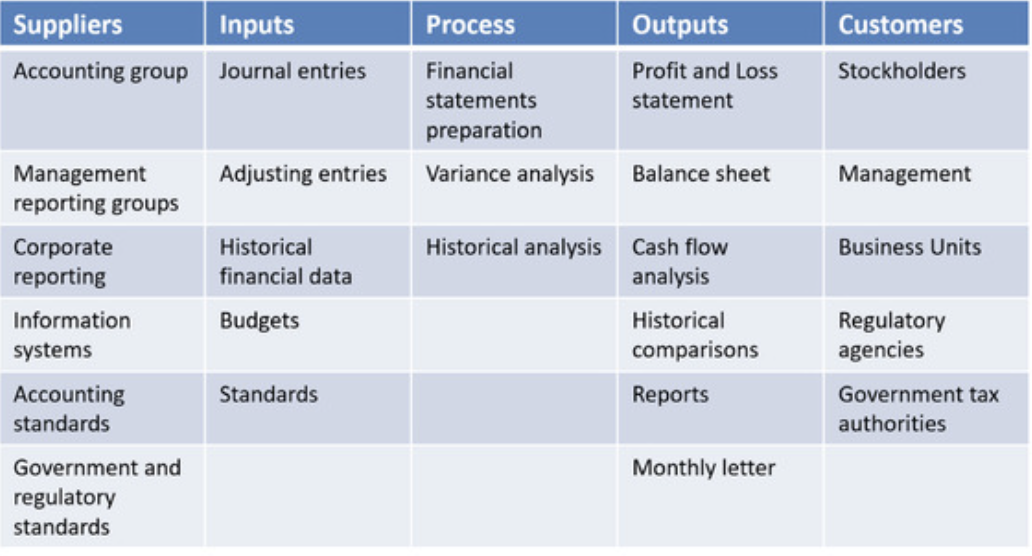
SIPOC#
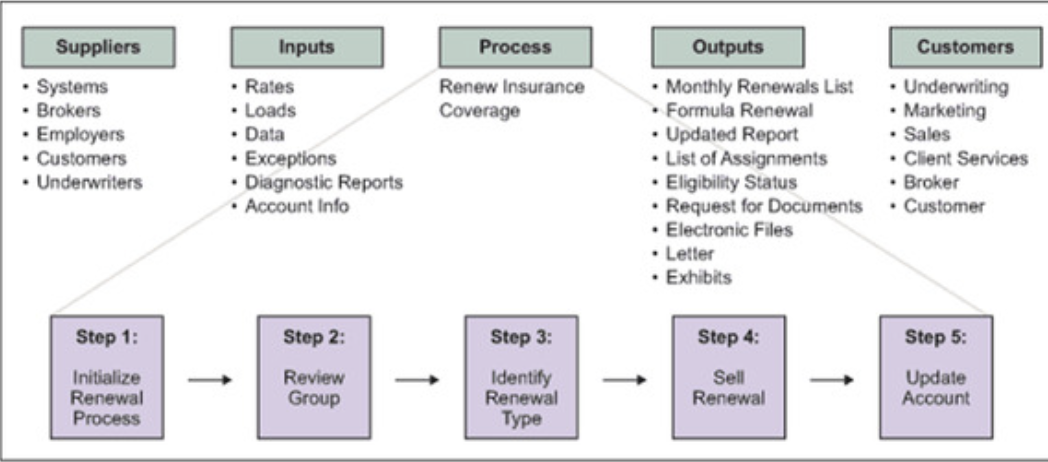
There are 5 component for SIPOC
- Suppliers
- Inputs
- Process
- Outputs
- Customers
By engaging a broad range of stakeholders, the SIPOC will represent how different individual involved in the Six Sigma Project
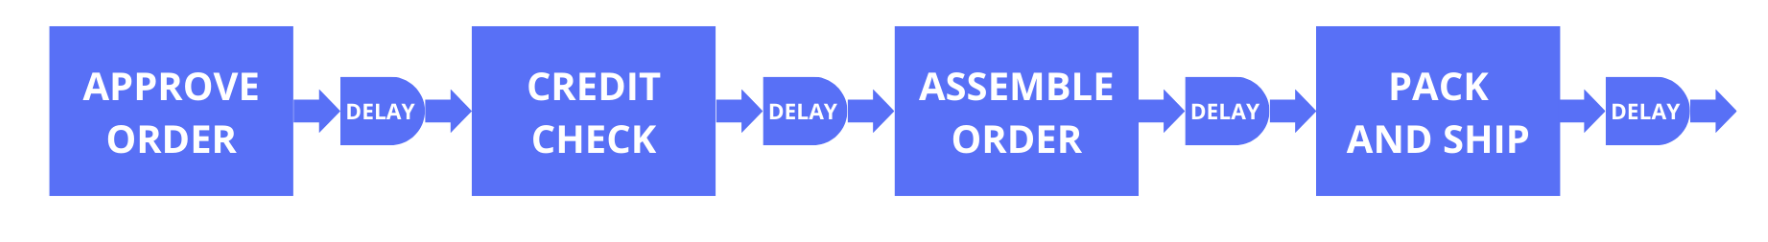
Productive Time and Elasped Time#
A major goal of lean is to eliminate process steps that a little or no customer value. A systematic method for evaluating the necessary steps is to create a value stream map which identified all steps are certainly major steps in the process. This represents the measurement steps associated with DMAIC. This steps are analyze to determined where in the process delay occurred. Once this is determined steps are taken if appropriate to implement a solution to the problem by eliminating this delays. Finally, controls are established to ensure that delays to not be emerge to interfere with the efficiency of the process. Analysis phase is certainly critical in this process because it is here that the steps that at no values are identified. The goal is such that when these steps are eliminated only value added steps will remain.
What is meant by value added?#
In lean, value-added is specifically linked to the value the customer received from the product or service. Value is defined from a customer, not organization’s perspective
Value Stream Mapping#
The purpose of Batre mapping is to document this process, identify where they need improvement and then improve them. It can be used to establish abroad view of a process and to identify ways and delay between the process steps.
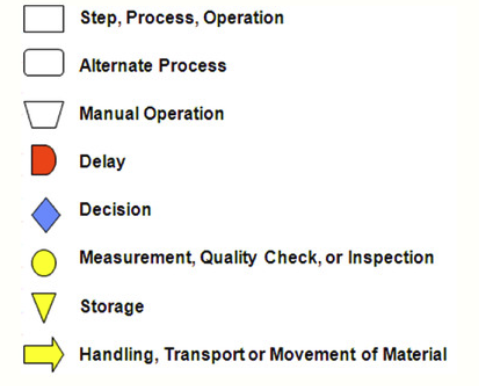
Process Mapping#
In contrast, a process map takes a more detailed views of the steps in the process. It begins with the outputs associated with the process and the process input. Then it further breaks the process down into inputs and outputs associated with each step.
The level of detail associated with this process map will depends upon the problems or opportunity that must be addressed as well as objected of the project.
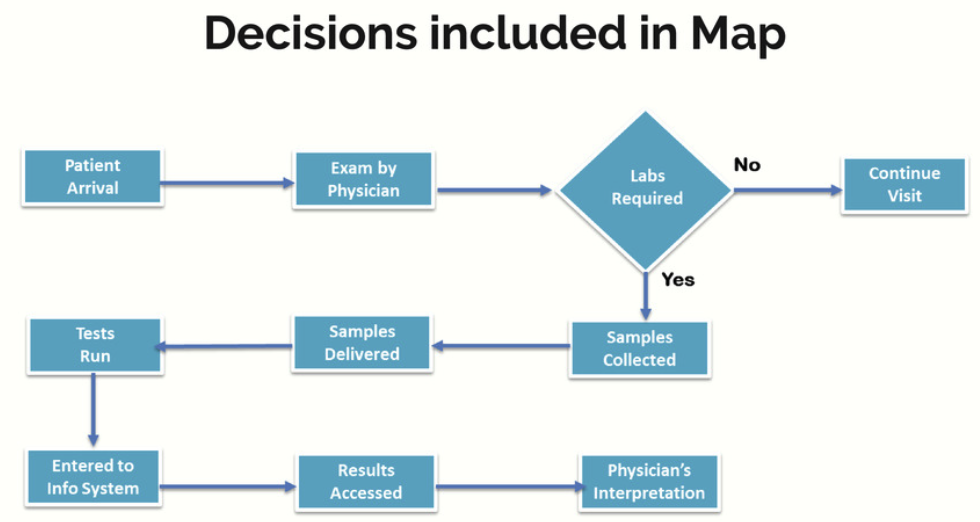
Decision in Process Maps:
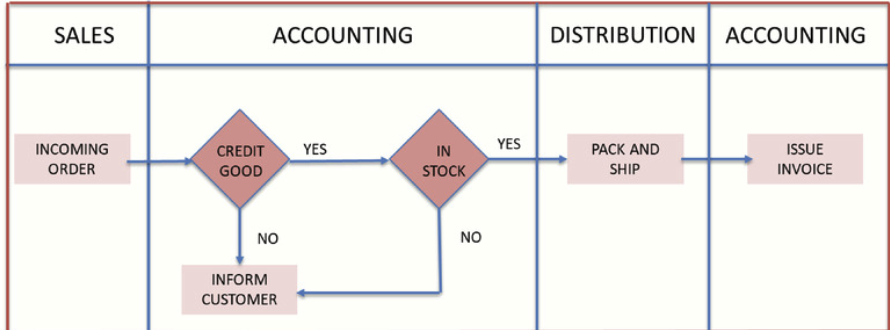
Cross Departmental Process Map:
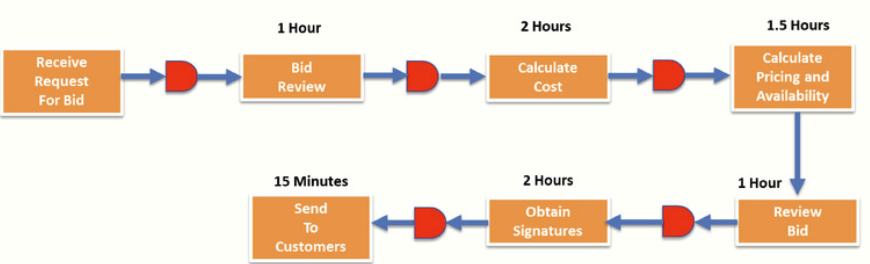
Process Map with Expected Activity Times:
To create an effective process map, it is recommended that the process mapping session will be held with those who will be involved in the project.
Here are the steps that should be followed:
- Defined a problem
- Identify the start and end point
- Determine the level of detail required
- Engage in the walk-through to ensure an accurate view of the of process
- Draw the map
- Undertake additional draft if necessary
Besides process map, another useful map use in analyzing process flow is a spaghetti diagram.
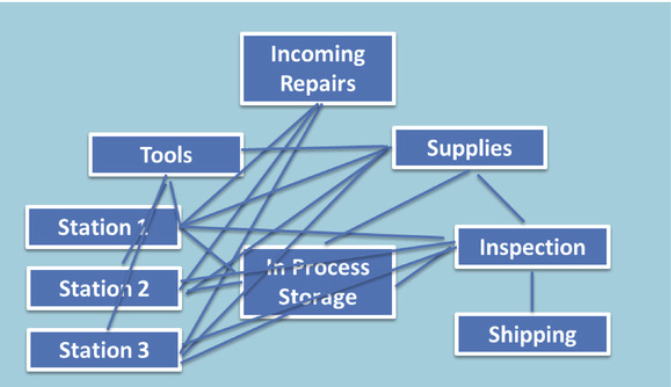
Once this is done, the team can analyze the diagrams to eliminate unnecessary movement through the system.
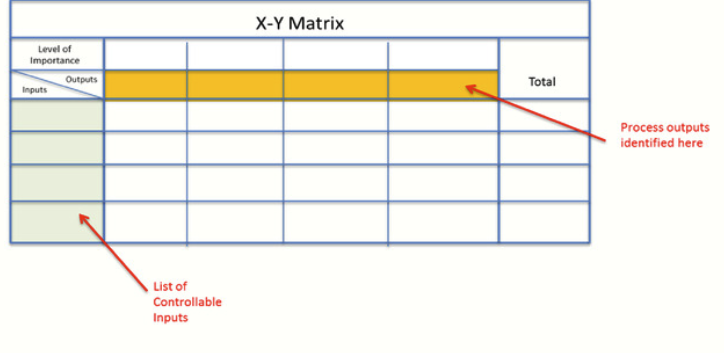
X-Y Matrix#
The X-Y matrix is allso call the correlation matrix, is instructor approach to ranking the importance of input variables. Input an outputs are identified, and then the impact of each of these input on output is determined. It is quite versatile and can be used to analyze entire or part of the process. It can be used to analyze the impact of inputs on outputs for a new products, or you can be used to determine the impact of inputs on output for website that has failed to perform as expected.
Example of input data:
- Product qualiity
- Product mix
- Price
- Promotion
- Keyword
- Website navigation
- Search engine optimization
- Video usage on homepage
- Website content
Example of output:
Length of time customer spent on site
Purchases made
Whether or not customer sign up for emails for promotional announcement
Whether or not, they likely to return to the side at the late time
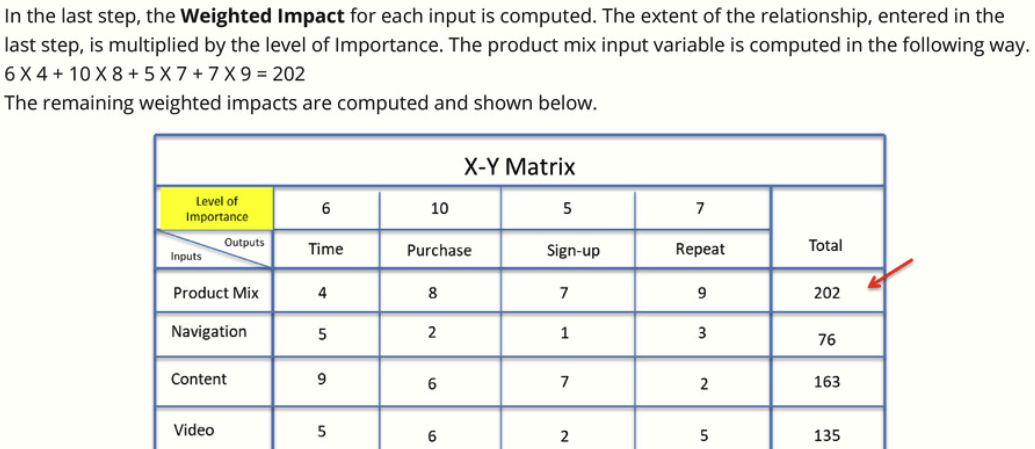
How to interpret the results?
The result of the X-Y analysis suggest that most important variables to address is product mix a weighted score of 202 dominoes the other weighted scores and it’s much higher than the next closest input variable, content. The least important variables is navigation with a score of 76 the payoff from adjusting this variable when improving the side would probably not very high.
Kanban#
Kanban is a lean approach to scheduling. It matches a schedule to actual demand, thereby improving process efficiency. It supports a Just in Time Approach to scheduling daily operations. Work does not begin on a product or service until a demand event occurs. When this event occurs, the process’s inputs are made available just as needed or “JIT”
Advantages
- Short cycle time between orders and delivery
- Better control of in process activity
- Reduction in waste
- Elimination of activity that do not add values to the outcome
- Rapid feedback loop that improve team performance and motivation
- Increase customer satisfaction
Two Bin Kanban#
The Two Bin Kanban system is a example of how variations of Kanban system can be used when surprise parts even finish product need to be managed and controlled.
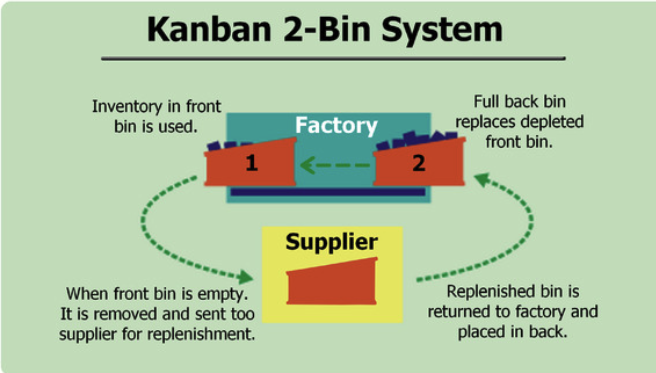
User select inventory items from Bin 1, the front bin. When Bin 1 is depleted, a replenishment order is sent to the supplier, and Bin 2 becomes the new Bin 1. When the replenishment order arrives, it becomes the new Bin 2.
It is in this way that the Kanban system directly links demand with processing.
Takt time(Rate of Completion)#
In lean, Takt time is the rate at which fitness products need to be completed to meet the customer demand suppose a company has a Takt time of five minutes, in that case, that means every five minutes a complete product assembly on machine must be delivered from operational process because customer is purchasing a finished product every five minutes.
Mathematically, Takt time is:
$$ \text{Takt time} = \frac{\text{Available time for production}}{\text{required units of production}} $$Available time for production of processing increase the total number of hours that you actually be devoted to processing. It must be net of breaks, lunch, or meeting. The required units of production are measure of demand.
{Question} An assembly facility operate for 2000 minutes per day customers demand is 500 units per day. The takt time is?
2000/500 = 4 mins
Answer: The facility must process a unit of output every four minutes.